Report SaaS companies collect, analyse and leverage SaaS business’ data, affording these businesses greater visibility into their performance. This allows SaaS businesses to make better informed, data-driven decisions that propel their success.
There are a number of tools created by report SaaS that have the ability to drive improvements in other SaaS businesses, by sharing findings from data as easy-to-understand insights.
This includes the Founderpath platform, which offers free reporting for bootstrapped SaaS founders designed to give SaaS businesses insight they can use to acquire customers more quickly, at a lower cost.
Let’s talk about what a report SaaS is, the advantages it provides and which tools you can use to empower your SaaS business.
What is Report SaaS?
Report SaaS businesses sell software that monitor key metrics, that help track SaaS business performance, achieved with the help of reporting and analytics tools.
These metrics are monitored primarily to determine SaaS businesses’ growth. This is vital in the fast-growing SaaS market, which often expels SaaS businesses with a growth rate less than 20%.
Report SaaS enables businesses to track these vital metrics, and identify potential areas for improvement so they can make data-driven decisions to maximize their growth.
Top 5 SaaS Reporting Tools You Can Use to Get Started
1. Stripe
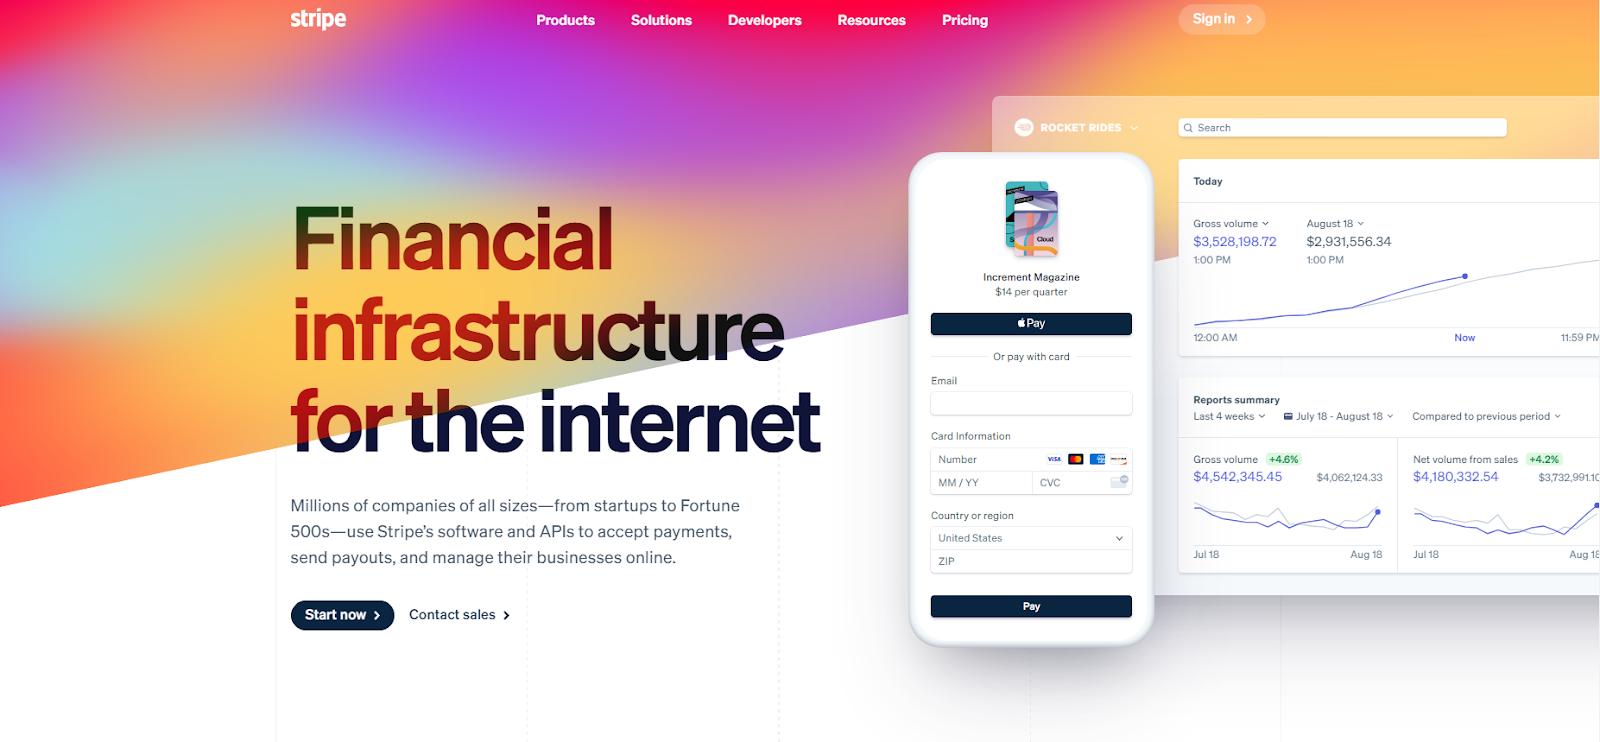
Stripe is a financial services and SaaS company best known for their payment processing software, which empowers merchants to receive payment and/or send money online. SaaS founders can also request capital from the Founderpath Stripe App, to help grow their business.
More than this, however, Stripe provides automated revenue reporting for SaaS businesses, including features such as income statements and revenue waterfall tables.

2. Profitwell
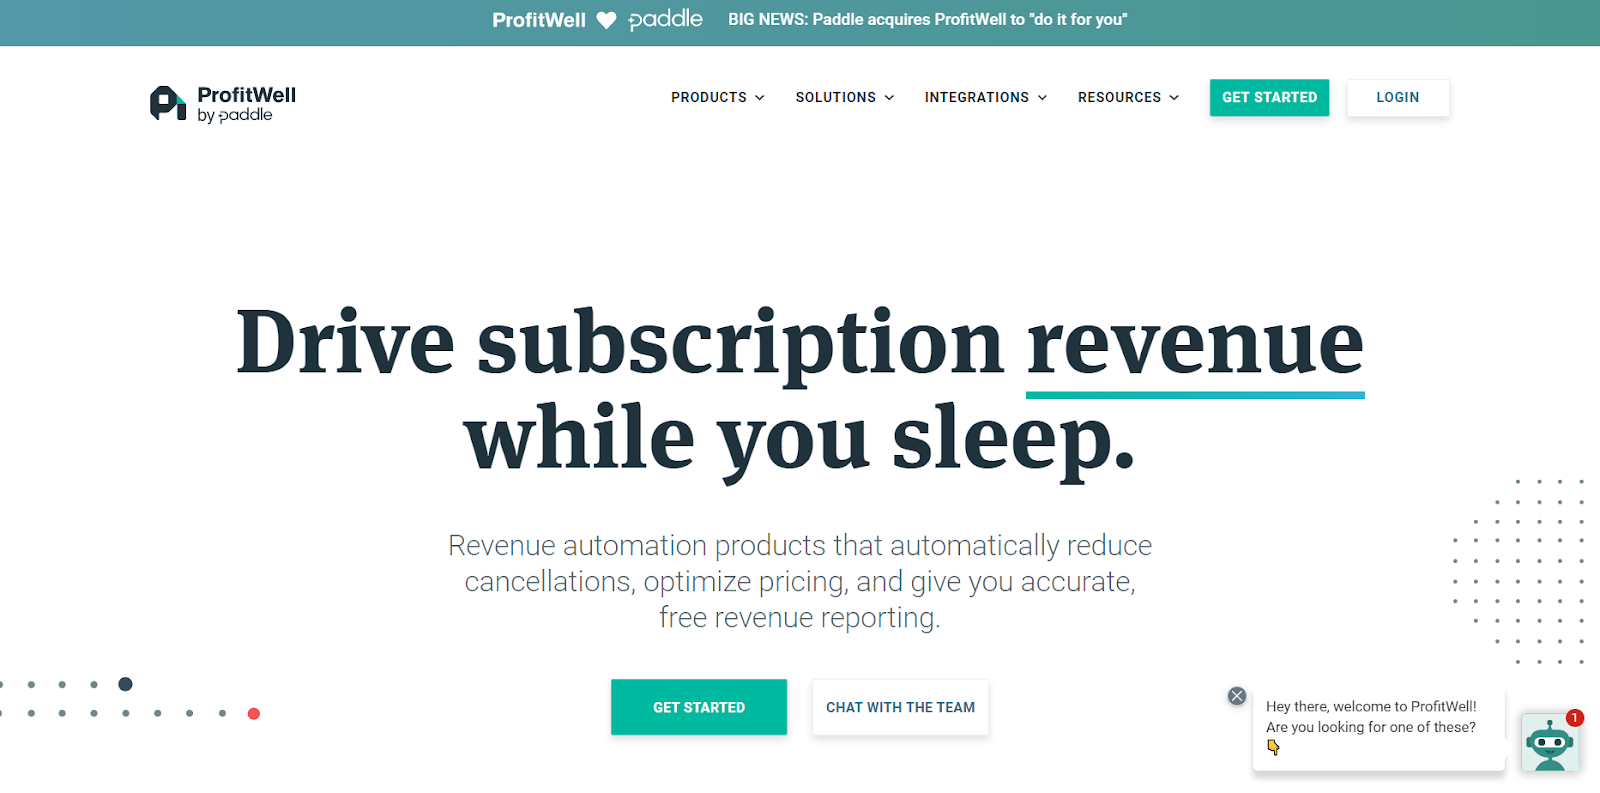
A specialist in SaaS reporting, Profitwell offers analytics that provide insight into subscriptions and customer behavior. This helps to improve customer retention, decrease the churn-rate and drive growth.
Profitwell’s SaaS reports use data gathered in real-time to provide the most up-to-date suggestions for improvements, highlighting areas of potential.

3. Baremetrics.
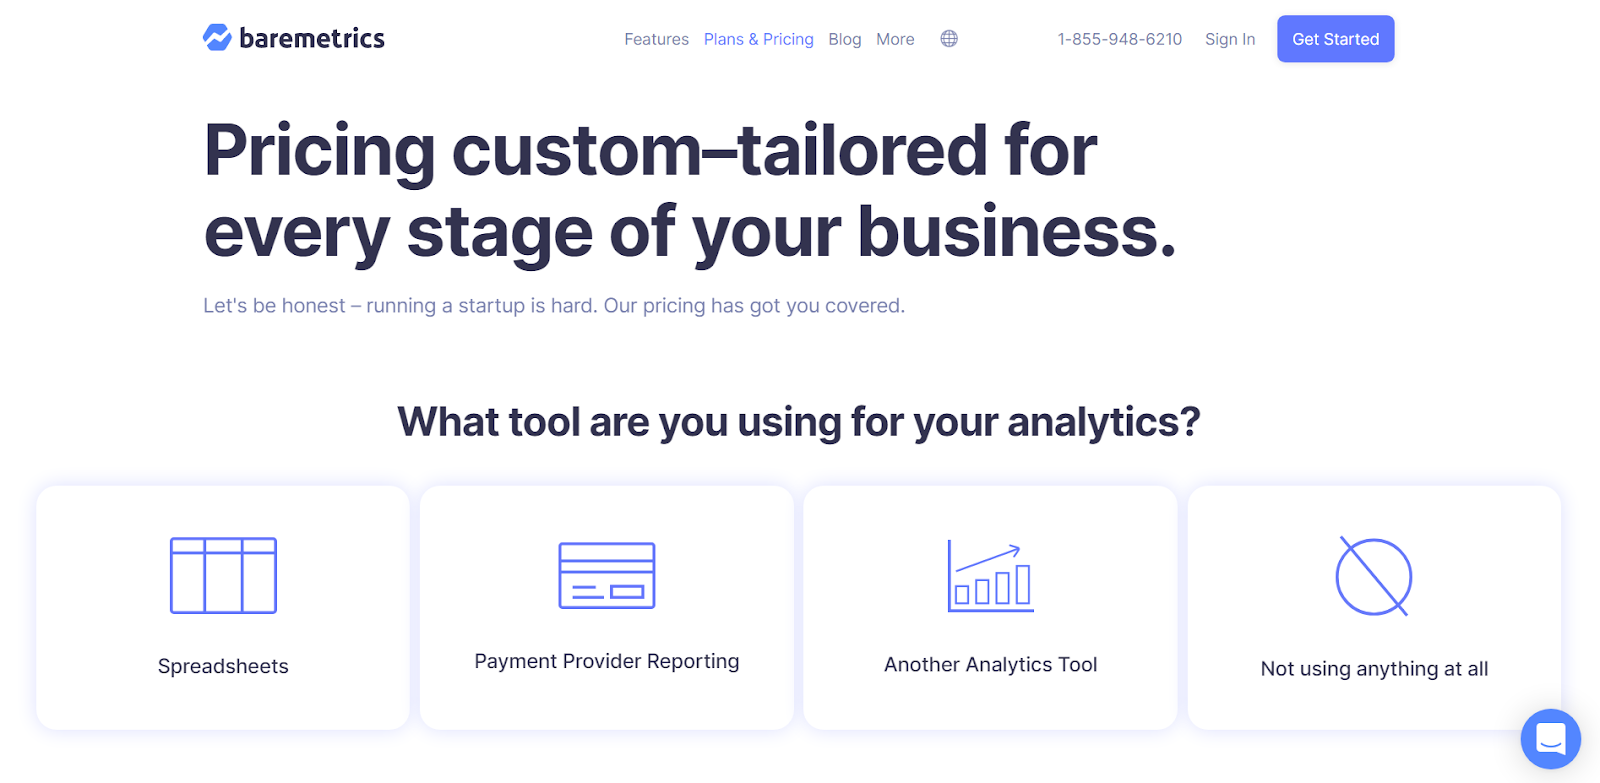
By integrating with SaaS business’ Stripe payment gateway, Baremetrics is able to siphon information about customer transactions directly from the SaaS platform or app to the Baremetrics tool.
From here, Baremetrics provides analytics allowing SaaS businesses to boost their active customer base by reducing churn, increasing customer retention and attracting new customers to the product.

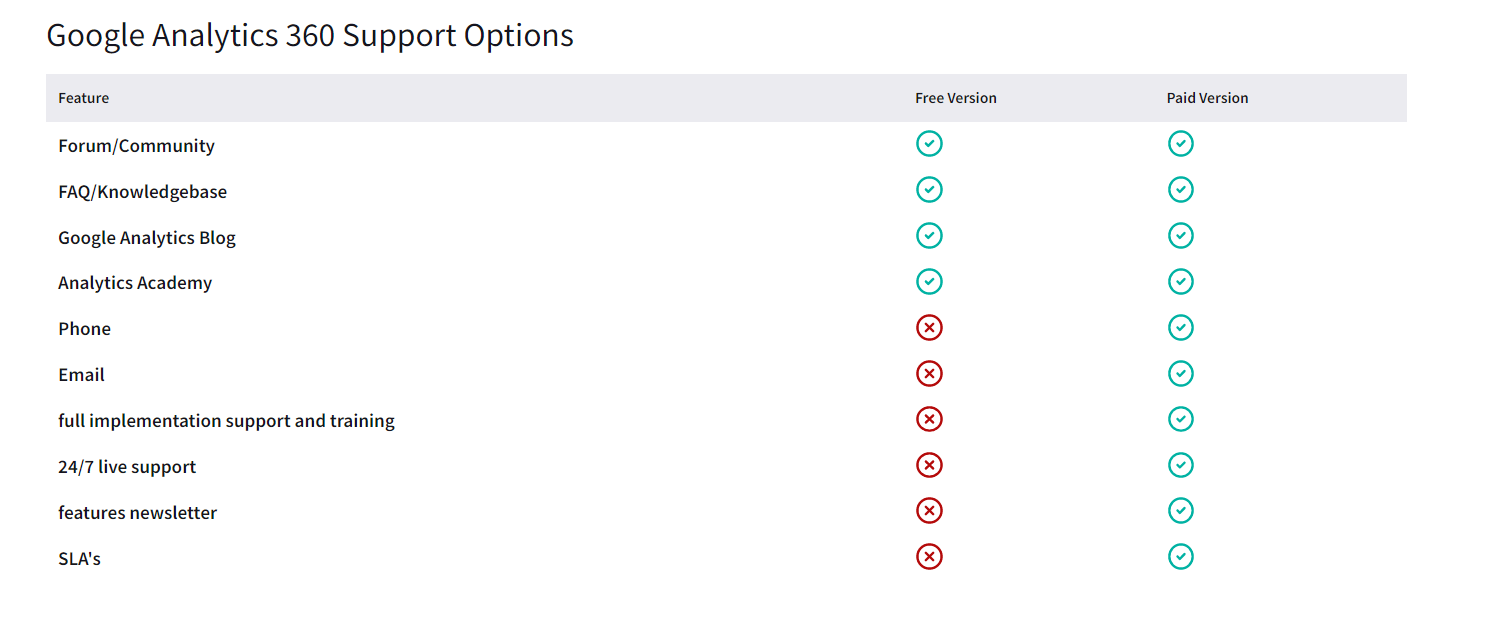
4. Google Analytics.
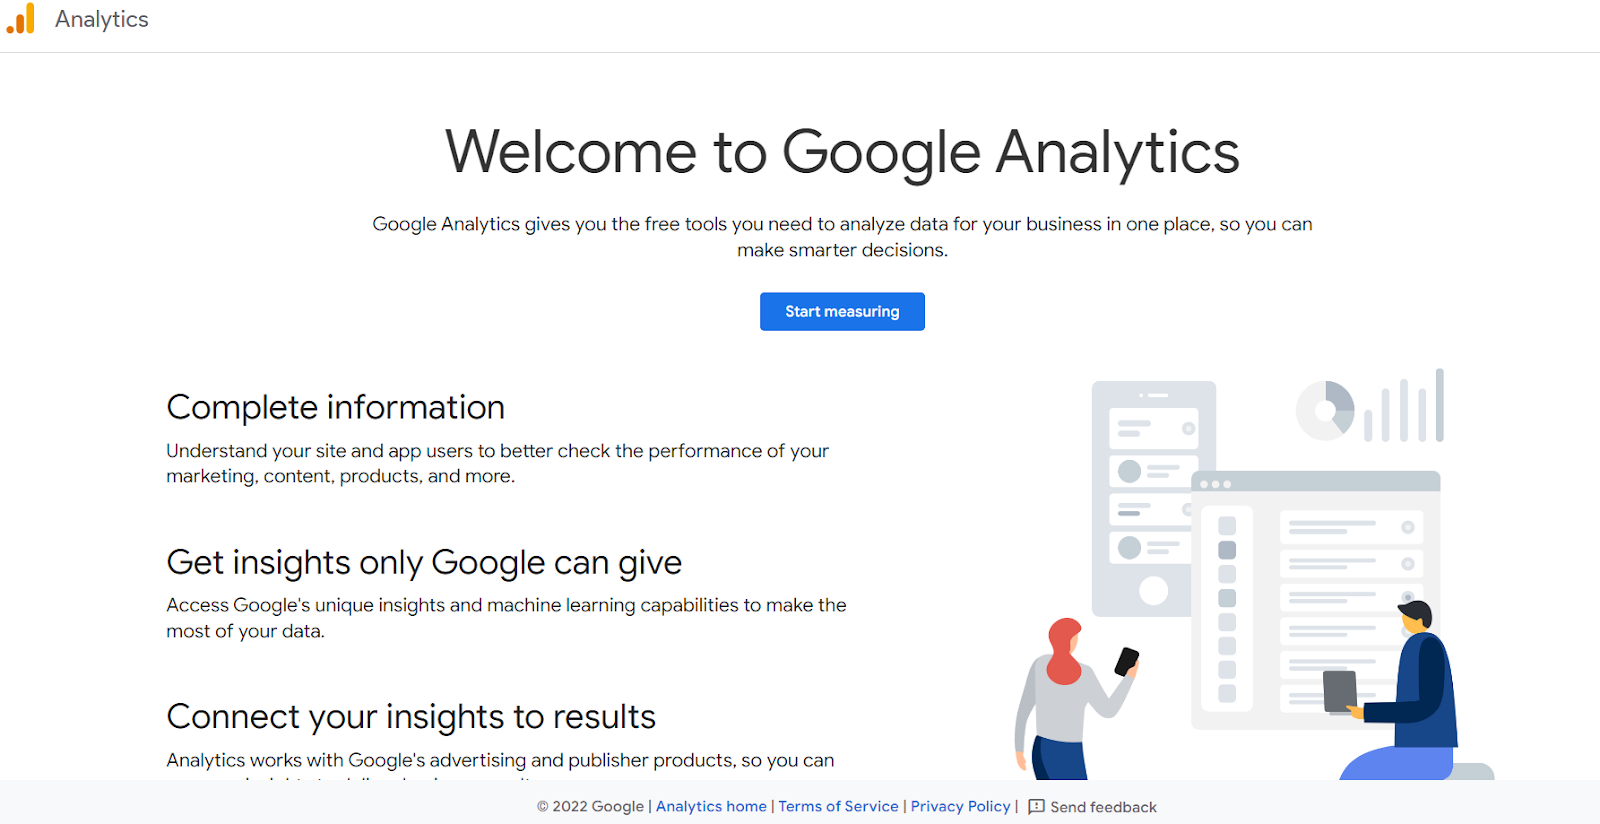
Not SaaS-specific – but an essential tool for SaaS businesses all the same – Google Analytics provides targeted insight into your customers’ activity online.
This can include how customers and leads behave on your website, plus how they interact with ads and your marketing strategy as a whole. This allows you to discover which of your marketing tactics has the most impact, in terms of content and location.
5. Search Console
A free analytics tool from Google, Search Console focuses specifically on website performance.
Search Console’s primary purpose is to help businesses rank more highly in Google’s search results by helping businesses to resolve website problems, but also provides insight into web traffic and visitor interactions with the site.
Why is Report SaaS Important?
There are numerous reasons why the visibility report SaaS provides is so impactful for the growth of other SaaS businesses.
Here are our top three.
It can help you develop future marketing plans.
By tracking key metrics, you’re able to gain insight into the effectiveness of your marketing campaigns.
Using SaaS Report allows you to identify the tactics that worked, those that didn’t, and aspects that your customers respond to while using your product or interacting with your brand.
Armed with this knowledge, you can devise the most effective marketing plan to engage future customers.
It can guide budget planning.
Effective budget planning can have a huge impact on the earnings of your business.
By tracking key metrics with your SaaS report, you can easily determine how much money your SaaS business has to spend on areas such as product development or marketing. This is true for both the present, and the future, since SaaS reporting enables informed forecasting.
It helps you to increase user conversion rate.
SaaS reporting provides insight into the behavior of your customers and leads.
This insight enables you to identify the type of customer – a.k.a. who they are and where they’ve come from – who’re most likely to convert. Knowing this, you can adapt your marketing and sales strategies to target these customers in a way most likely to appeal to them.
How to Use SaaS Reporting Metrics.
There are many potential metrics you can monitor with SaaS reporting, but here are some of the top SaaS KPIs & metrics to track.
Monthly Recurring Revenue (MRR).
The MMR is calculated by multiplying the average revenue generated per user with the number of active subscribers using your SaaS product.
As such, the MMR is representative of the total amount of revenue your SaaS business receives monthly.
For example, if the average revenue generated per user is $50, and your SaaS product has 200 active users, then your monthly recurring revenue would total $10,000.
Average Revenue Per Unit (ARPU).
To work out your SaaS business’ ARPU, divide the MRR by the number of active customers your business has.
So, if your monthly recurring revenue is $25,000, and your business has 1000 active customers, your average revenue per unit (ARPU) would be $25 ( 25000/1000 = 25).
This gives you the average value of each ‘unit’ – a.k.a. your SaaS product – sold, and hence the average amount each of your customers is spending over a given period. This can help to inform pricing and subsequently, be used to boost revenue.
Customer Acquisition Cost (CAC).
Your CAC is calculated by dividing the total cost spent on customer acquisition – a.k.a. any advertising or marketing strategies you’ve employed – within a given period, by the number of new customers you obtained within that time frame.
For example, say you spent $2000 on marketing in the month of October, and you acquired 500 new customers in that time, then your average CAC would be $4 ( 2000/500 = 4 ).
Your CAC has a huge impact on the profitability of your SaaS business. A low customer acquisition cost means greater profits, since you’ll obtain revenue-generating customers inexpensively, compared to a high CAC.
.
Cost of Goods Sold (COGS).
The COGS comprises the total amount spent on SaaS development and delivery.
In SaaS, the costs that make up the total COGS may include web hosting, the salary of software developers who built the product, and any other costs it took to create your product and get it out into the world.
COGS is essential for calculating profit, since this value is deducted from the total revenue generated from your SaaS product.
Churn Rate.
To calculate your monthly percentage churn rate, this formula is used:
(Customers at the Beginning of the Month – Customers at the End of the Month)
—————————————————————————————————–
Customers at the Beginning of the Month
Churn rate is important to determine how quickly you’re losing customers. If your percentage churn is high, it indicates improvements need to be made to your SaaS product or customer experience to increase satisfaction amongst your customers.
Customer Lifetime Value (CLV).
There are a number of ways to calculate your SaaS business’ CLV. Depending on your business, you may want to take into account a host of factors when making this calculation.
However, the simplest method is to multiply the ARPU (average revenue per unit), with the number of months your customer has subscribed to your SaaS product.
For instance, if your ARPU is $45 and your average customer subscribes to your SaaS product for 8 months, then your CLV would amount to $360 ( 45*8 = 360 ).
By determining your CLV, you can gauge the average earnings you make from each customer before they terminate their relationship with your business. This allows you to gauge how much you can afford to spend acquiring customers, and indicate whether improvements are necessary to improve retention.
Annual Recurring Revenue (ARR).
Your SaaS business’ ARR can be calculated by subtracting the revenue lost through cancellations, from the total value of subscriptions contracted for that year. This includes any in-product purchases.
If the total value of subscriptions for the year totalled $200,000, and the value of in-product upgrades and add-ons amounted to $20,000, but you lost $17,000 revenue due to cancellations, your ARR would be $203,000 ( (200,000 + 20,000) – 17,000 = 203,000 ).
Measuring your ARR allows you to measure your business’ growth year by year, forecast future earnings and indicate the success of your subscription model, making it a vital metric for SaaS businesses’ success.
Conclusion…
Using a report SaaS product is one of the smartest decisions an SaaS founder can make, to keep abreast of the most important metrics relating to their SaaS business and ensuring they always understand the extent of their company’s performance.
By having constant access to the insights provided by this data, SaaS businesses can use their reporting to identify areas of improvement and consistently boost their growth.
Founderpath offers bootstrapped SaaS businesses free reporting functionality for some of the most essential metrics, including churn, CAC, ARPU and LTV. However, their advanced features allow SaaS businesses to identify their highest value customers, as well as those who are likely to purchase more.
