How do you measure the performance of your SaaS business? What benchmarks do you use to see whether you’re on the right track?
Many SaaS founders struggle to track the success of their products. Data availability isn’t the problem, as product analytics platforms are capable of measuring just almost anything.
The secret lies in selecting the right key performance indicators or KPIs. Using the right metrics can help you unlock insights into everything from customer engagement to marketing campaign performance.
What are SaaS KPIs? Why are they important? What KPIs should your SaaS business target? How can you measure & track SaaS KPIs?
In this article, Founderpath will list the key B2B SaaS KPIs that your startup should be tracking in 2022.
What is a SaaS KPI? Why do we track them?
Key Performance Indicators (KPIs) are metrics and indices that inform SaaS businesses about how well their product is performing. This can be either a high-level view of the entire company’s performance or a specific look at how well a department is contributing to these business goals.
What are KPIs used for? They help guide business decision-making as they provide robust feedback mechanisms on company performance. KPIs set themselves apart from other, more general metrics by being laser-focused on business objectives.
SaaS founders can use KPI optimization as a means to achieve company goals such as increasing market share, boosting revenue and growing their user base.
What makes a good SaaS KPI?
How do you choose which KPIs to target? We’ll cover some essential metrics to track later on, but let’s first introduce you to some criteria for a great KPI.
We recommend following the SMART framework when assessing which metrics to track:
- Specific: Is the metric specific? Does it refer to a specific quality or fact about your SaaS product? Is it too general to be useful?
- Measurable: Can you effectively measure this metric? Can product analytics platforms like Founderpath efficiently track it?
- Attainable: Can you conceivably influence this metric? How difficult is it to improve it?
- Relevant: Is the metric relevant to your business and its objectives? Is it a metric that is applicable to your product?
- Time-Bound: Can this metric be defined and measured over a specific time period?
Not every KPI will meet all of these requirements. But metrics that fit this framework will have a better chance of being aligned with actionable goals.
Best KPIs to Track for B2B SaaS Products
Customer Churn Rate
How can you tell whether a SaaS product is failing? The success of a SaaS business depends on whether customers want to stick around and pay for the product.
Why? In such a competitive market, the cost of acquiring new customers is high. A startup that converts lots of customers through marketing but fails to retain them will burn through cash quickly with little return.
That’s why you should measure your customer churn rate. It represents the percentage of customers who have stopped using your SaaS product during a certain time period.
The churn rate formula is as follows:

Losing customers is a natural part of running a SaaS business. There will always be people who don’t need your product anymore. But high monthly churn rates (>10%) suggest that users’ needs aren’t being met.
What causes this? Common reasons for churn include:
- A poor onboarding experience leaves new customers confused about how your product works.
- Poor website performance and stability issues
- Lack of new features and functionality
- A price that is too high. High prices, especially after a price hike, are a big reason customers don’t return – especially if competitors undercut you.
Revenue Churn Rate
Customers are not all as equally valuable. Observing the number of customers doesn’t reveal how much revenue is leaking out.
For example, if your SaaS product is churning its high-paying Enterprise tier customers, this may not show up as a significant customer churn issue using that previous formula.
The revenue churn rate reveals how much revenue is lost through customers leaving your platform.
We are only considering revenue from existing customers and ignoring revenue from new subscribers for this calculation:
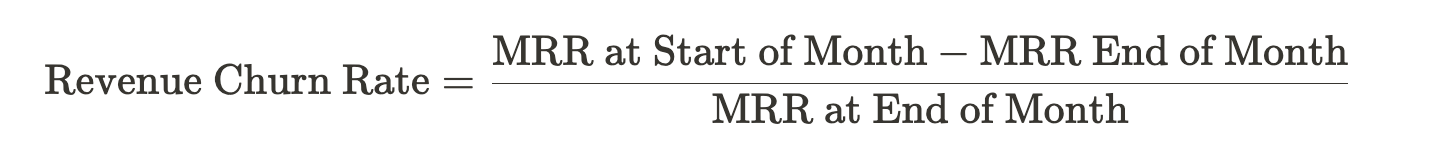
As we’re ignoring the revenue from new customers, this KPI is simply the percentage change in MRR.
If you offer multiple tiers, you may have customers upgrading and downgrading their packages. How do you add this to the Revenue Churn Formula?

Revenue Churn Rate provides a better insight into the actual impact of losing customers.
Monthly Recurring Revenue
Monthly Recurring Revenue – or MRR – refers to the predictable & stable monthly revenue stream for your company. For traditional businesses, this can be quite difficult to calculate as it’s tricky to know which streams are predictable.
But SaaS businesses use a subscription-based model – and so it’s pretty straightforward to calculate:

We can split MRR down into the following categories:
- New MRR: Revenue gained from new customers
- Expansion/Upgrade MRR: Revenue from existing customers who upgrade their subscriptions or purchase additional products.
- Downgrade MRR: Revenue lost from existing customers downgrading their plan or removing add-ons.
- Churned MRR: Revenue lost from existing customers who cancel their plan.
In fact, these categories can be used to calculate a slightly more accurate MRR.

Given how predictable MRR is, it can be used to forecast your company’s revenues. For SaaS businesses, MRR is so stable that lenders offer bootstrapped SaaS startups cash advance based on their predicted revenue.
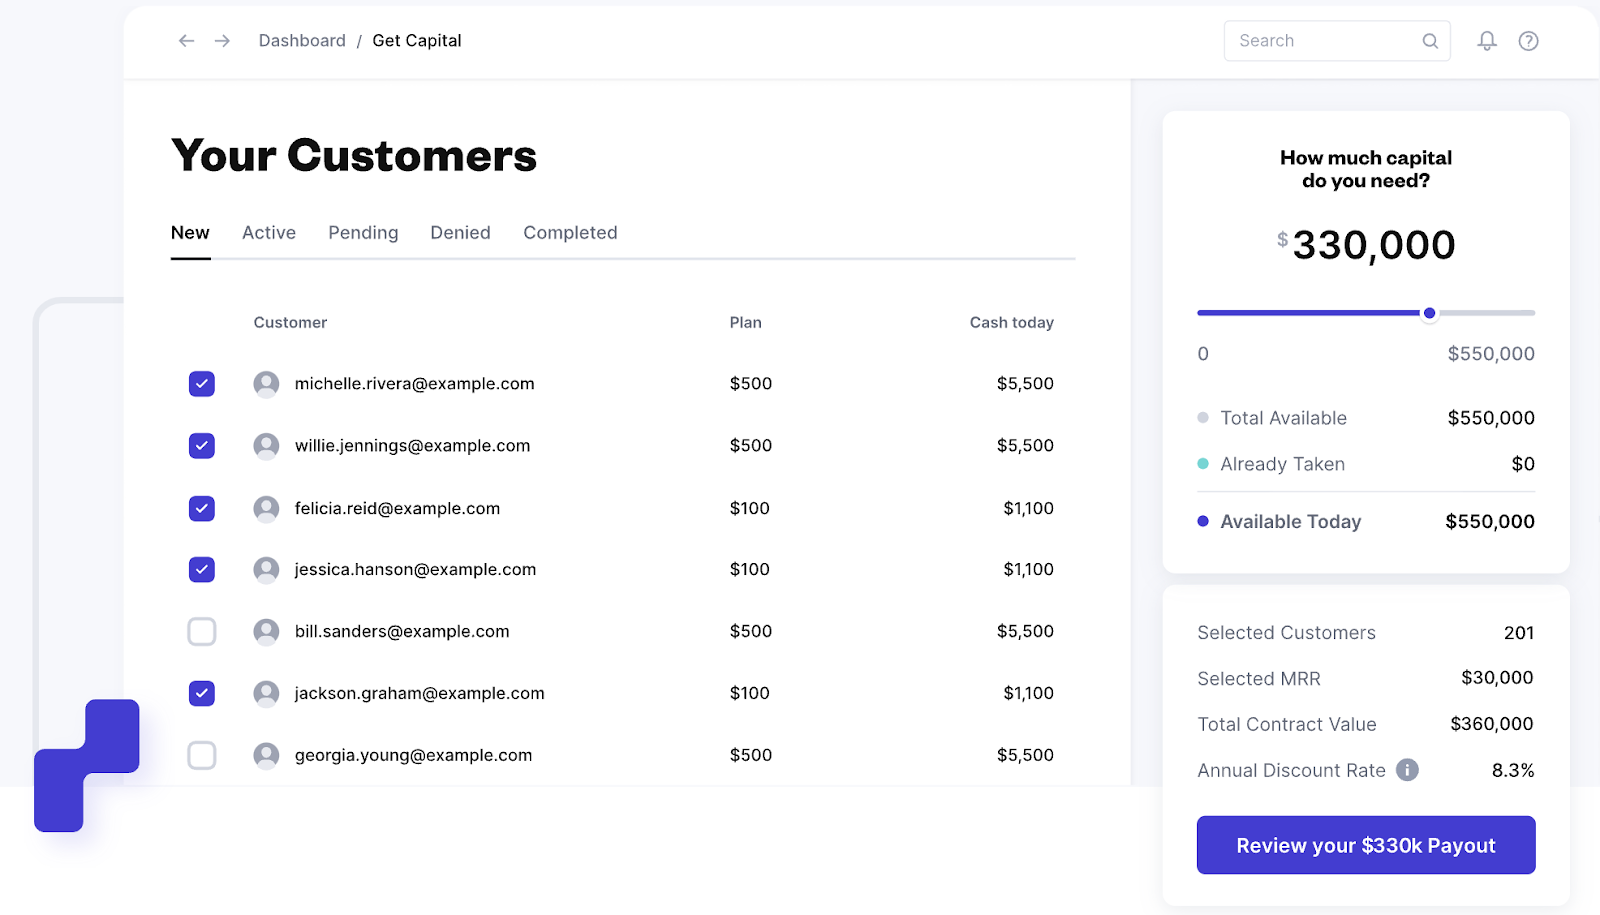
With Founderpath, you can turn your predictable MRR into significant cash advances to grow your business.
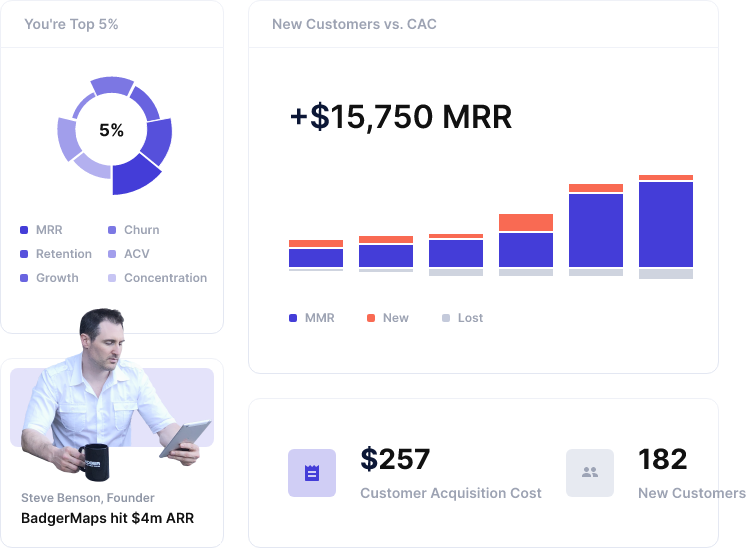
Customer Acquisition Cost
Customer acquisition cost (CAC) measures how much your SaaS business spends on acquiring new customers. It essentially shows the per-unit costs of your marketing and sales efforts.
Here’s how you calculate CAC:
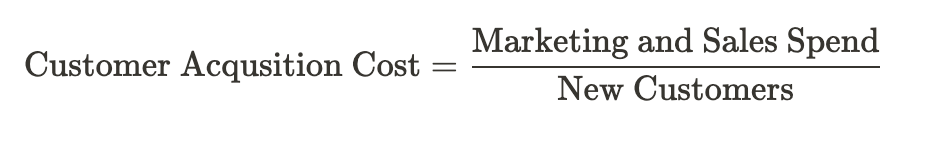
CAC demonstrates the effectiveness of your marketing campaigns. If you suffer from a high acquisition cost, you’re likely experiencing a low conversion rate. Are your campaigns tailored enough? Are you using the most effective channels for your target audience?
Stuck on how to execute your SaaS marketing strategy? Read our complete guide on the topic here.
Average Revenue Per User (ARPU)
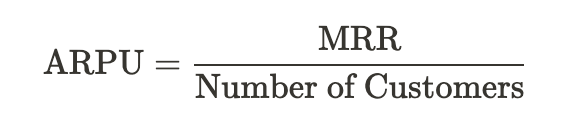
Average Revenue Per User – or ARPU – demonstrates how much an average user (or account) will spend on your product during a specific time period. This metric is used mainly as a component of other, more notable, KPIs.
If you have multiple products, comparing ARPUs can give you a rough overview of which are more valuable.
Here’s how you calculate ARPU:
Pretty simple, right?
Customer Lifetime Value (CLV/LTV)
Customer Lifetime Value – or CLV/LTV (depending on who you ask) – describes the amount a customer is expected to spend over the lifetime of their subscription.
To start off our calculation, we’ll need to find out how long, on average, customers stay subscribed. We can estimate this by calculating the reciprocal of your churn rate:
Then, we’ll use the Average Revenue Per User (ARPU) we calculated earlier to find the average CLV:

CLV helps you measure the return gained through marketing and sales. It’s how much value is created by acquiring one new customer.
A low CLV can be caused by a high churn rate or may indicate your pricing is too low. The higher your lifetime value, the more effective your marketing efforts will be.
CLV:CAC Ratio
You can combine these two KPIs to find the true value of a customer to your SaaS business. Intuitively, this makes sense:
- CLV measures how much you gain from a customer.
- CAC measures how much you spend to acquire a customer.
Putting these two metrics together in one ratio can effectively give you the ROI of acquiring customers. How much do you stand to gain from spending the money to find a new customer?
For example, if you (on average) spend $450 to acquire a new customer but they will spend $1350 throughout their customer lifetime, the CLV:CAC ratio would be 3:1.
How do you interpret this result?
- If your CLV:CAC ratio is 1:1, you’re spending exactly as much to acquire as you would earn. In the long run (with overheads and taxes factored in) you’re likely losing money on each acquisition. You’ll need to either bring down your CAC by targeting your marketing or improve CLV by upselling.
- The “golden” ratio is 3:1, or at least it’s a good industry target. This suggests your ROI is 300%.
- In early-stage startups, if you’re experiencing a very high CLV:CAC ratio (>5:1), you’re likely underinvesting in marketing. You can afford to sacrifice this ratio and spend more on marketing to fuel growth.
Track SaaS KPIs and Turn Your MRR Into Cash with FounderPath
These 7 KPIs are essential metrics to track to measure the success of your SaaS business. Which are the most important?
- Churn rate indicates how many customers are leaving your product. It reveals your primary barrier to growth when spending to acquire new customers.
- Monthly Recurring Revenue (MRR) demonstrates the predictable success of your SaaS business. Grow your MRR and you’re likely seeing an equal rise in your bottom line.
At Founderpath, we believe tracking these KPIs is the best way to make informed business decisions. That’s why we’ve developed a free reporting tool to capture business metrics.
Need some help and advice growing your B2B SaaS? Why not join our ever-growing FounderLed community?
Finally, if you’re looking to raise some capital to fund your expansion, have you considered a low-risk cash advance? With FounderPath, you can easily turn your monthly subscriptions into upfront cash.Get started today at Founderpath.com!


